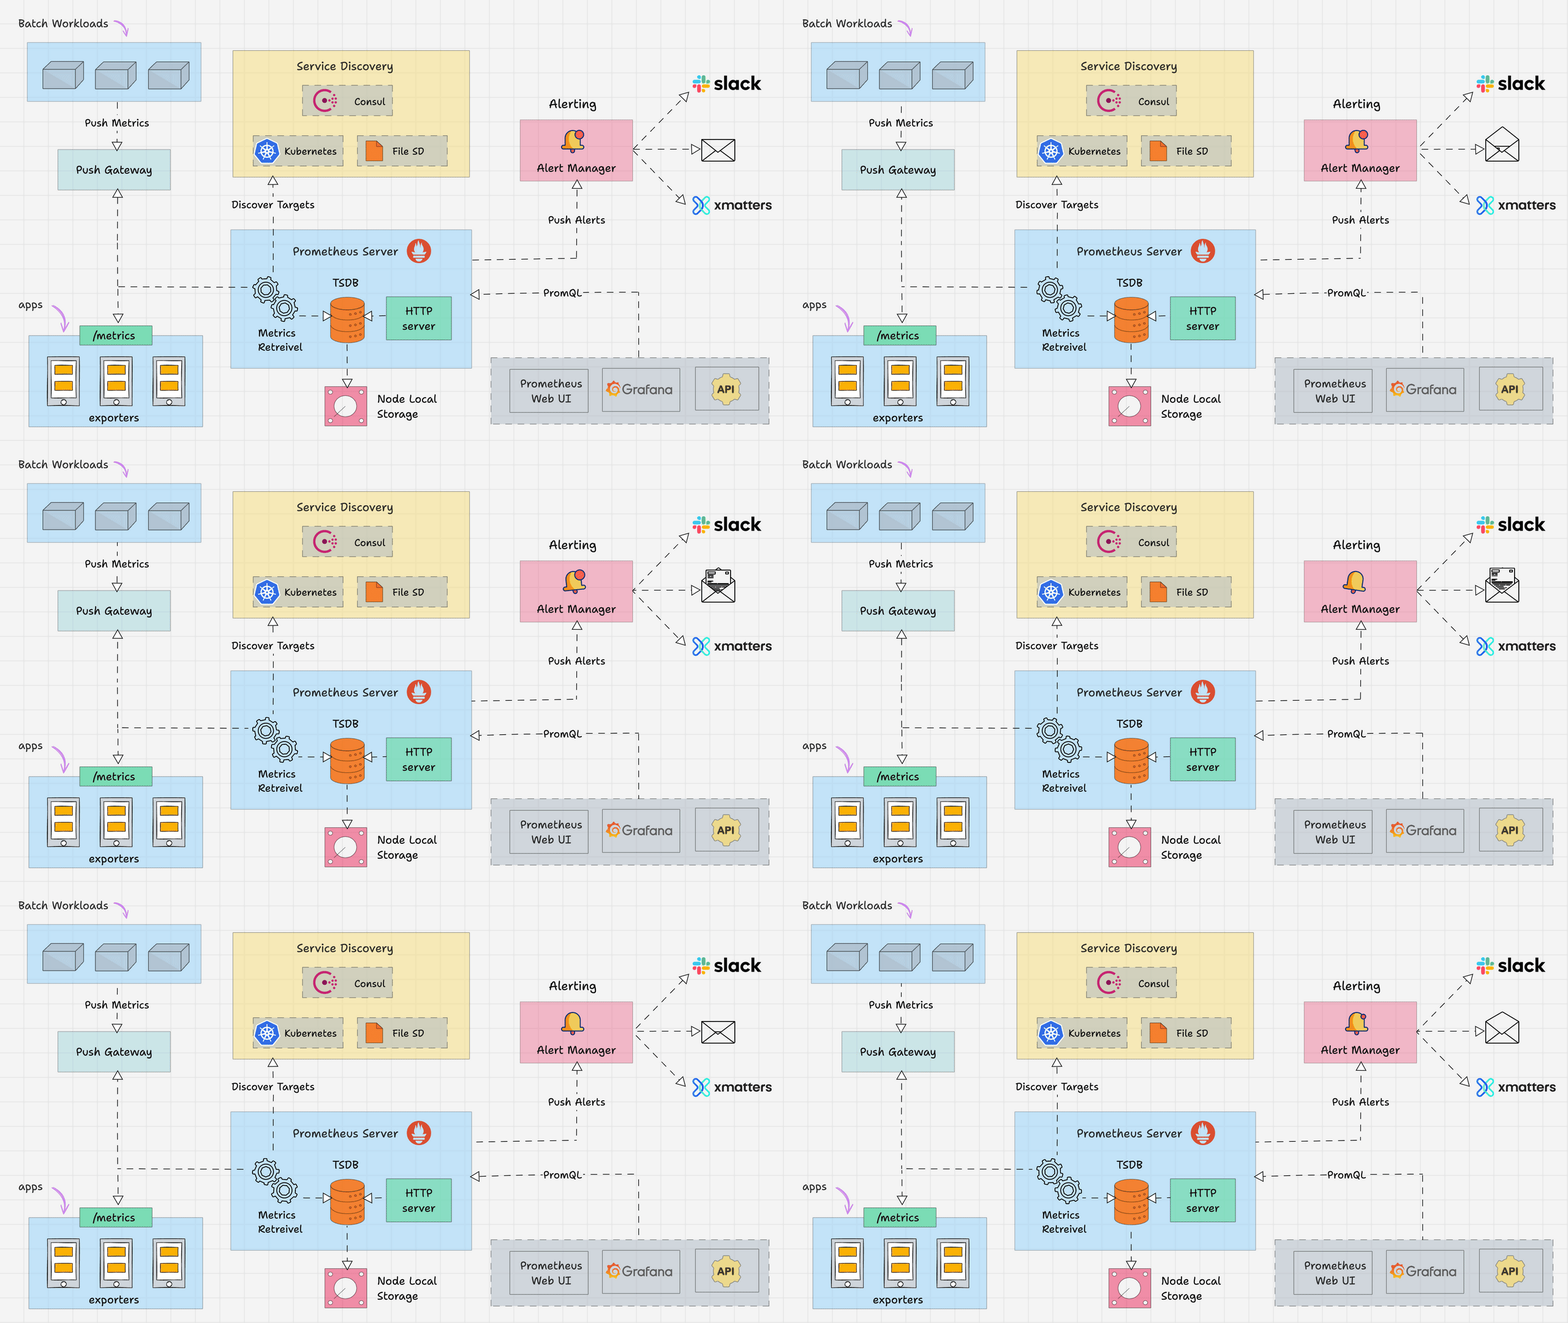
Prometheus Stack Architecture
Source: Learn Prometheus Architecture: A Complete Guide
Prometheus is an open-source monitoring and alerting system written in Go that collects and processes metrics from various targets using a pull model.

Prometheus Server
Uses pull model for scraping metrics from targets based on scrape intervals
Time-Series Database (TSDB)
- Stores metric data in efficient chunks on local disk
- Supports retention policies:
- Time-based: Default 15 days
- Size-based: Maximum storage limit
- Offers remote storage options for scalability
Targets
- Sources where Prometheus scrapes metrics (servers, pods, endpoints)
- Default metrics path:
/metrics - Configured under
scrape_configsin config file
Exporters
- Agents that convert system metrics to Prometheus format
- Examples: Node Exporter (CPU/memory), ElastiSearch Exporter
Service Discovery
- Static configs: targets with static endpoints
- Dynamic discovery: For auto-scaling systems (Kubernetes, EC2, Consul)
- Example:
kubernetes_sd_configsfor Kubernetes pods
Push Gateway
- Handles push-based metrics for short-lived jobs
- Acts as intermediate gateway
- Jobs push metrics via HTTP API
- Stores metrics temporarily in memory
Client Libraries
- Libraries for custom instrumentation
- Available for most programming languages
- Used to expose custom metrics in Prometheus format
Alert Manager
- Manages alerts from Prometheus
- Features: Deduplication, Grouping, Silencing, Routing by severity, Inhibition
- Supports multiple notification channels (email, Slack, PagerDuty)
PromQL
- Query language for time-series data
- Used in Prometheus UI, CLI, or Grafana dashboards